Ranking CS Graduate programs
Ranking Graduate Programs
While I was choosing graduate programs back in 2005, I decided to come up with my own ranking system. I had been reading about the Google PageRank algorithm, which essentially imagines the web as a bunch of random browsing sessions that rank pages based on the likelihood that you–after clicking around at random for a few years–will end up on any given page. It occurred to me that you could model graduate school rankings the same way. It’s essentially a four-step process:
- Pick a random department in the United States.
- Pick a random faculty member from that department.
- Go to that faculty member’s graduate department.
- 90% of the time, return to step 2; 10% of the time, return to step 1.
At the end of each stage, you’ll be in a different department; but more prestigiously any given department’s faculty are placed, the more likely you are to be there.
Using transition matrices, these numbers converge after a relatively short period.
I ran it on history departments, but have never circulated the history scores. (Rankings make people mad, and the benefit seems worse than the cost.) But one of my roommates at the time, Matthew Chingos, was already moving towards working in higher education policy and grad school in political science, so we wrote up a paper applying it to Political Science departments and published it in PS in 2007. (Schmidt, B., & Chingos, M. (2007). Ranking Doctoral Programs by Placement: A New Method. PS: Political Science & Politics, 40(3), 523-529. doi:10.1017/S1049096507070771)
It’s a pretty simple method, but I still occasionally get questions about it, the data, and the underlying code. As I recall, the political science data was viewed as slightly sensitive, so the arrangement we made with the American Political Science Association was that they would handle requests for the data and we would only provide code.
This was in 2005, so reproducibility was not a worry–nowadays, you’d put all this stuff on github. In response to a recent request, I’ve just done that.
The core code was interesting to look it, because it’s stuff I wrote in R fifteen years ago. It basically seems to still work, but it has little in common with how I’d handle the problem nowadays.
Ranking Computer Science Programs as of 2015
Still, the proof is in the eating. So I went looking for some new data to try it on. On the theory that computer science faculty are too distracted by their overwhelming course sizes and endless parade of job searches to be bothered by this, I’ll do them.
Alexandra Papoutsaki et al. created a crowdsourced dataset of CS faculty that they expect to be “80% correct” at Brown. They seem to have updated a version that’s sitting inside a Github repository here, so that’s what I’ve used. I’m using placements that are from 2005-2015 here.
| school | p |
|---|---|
| University of California - Berkeley | 17.2835408 |
| Massachusetts Institute of Technology | 16.6558147 |
| Stanford University | 9.8659918 |
| Carnegie Mellon University | 7.9750700 |
| University of Washington | 4.5314467 |
| Cornell University | 3.4656622 |
| Princeton University | 2.9223387 |
| University of Texas - Austin | 2.5394603 |
| Columbia University | 2.3110282 |
| University of California - Santa Barbara | 2.0507537 |
| California Institute of Technology | 1.9028543 |
| Georgia Institute of Technology | 1.5902598 |
| University of Illinois at Urbana-Champaign | 1.5324409 |
| University of California - Los Angeles | 1.5238573 |
| University of California - San Diego | 1.2106396 |
| University of Maryland - College Park | 1.1716862 |
| University of Pennsylvania | 1.0691726 |
| Brown University | 1.0167585 |
| University of North Carolina - Chapel Hill | 0.9371394 |
| University of Michigan | 0.9263730 |
| University of Minnesota - Twin Cities | 0.7845679 |
| Harvard University | 0.7668788 |
| New York University | 0.7561730 |
| University of Wisconsin - Madison | 0.7021781 |
| University of Massachusetts - Amherst | 0.6569323 |
| Purdue University | 0.6213802 |
| University of Chicago | 0.6157431 |
| Rice University | 0.6154933 |
| Johns Hopkins University | 0.5860418 |
| University of Virginia | 0.5794159 |
There is nothing shocking, as an outsider, here, which is good. Technical schools are pretty high up, and my current employer is on the list and right next to Harvard. Nobody ever got in trouble for saying their school is as good as Harvard, even when Harvard is–as in CS–not so hot.
Extensions
Error bars!
Besides reproducibility, one thing I didn’t have a good answer to back in 2005 was robustness. Now I know very slightly more statistics, and the most sensible approach seems to be bootstrap sampling across the set to get an idea of how much difference one student more or less might make.
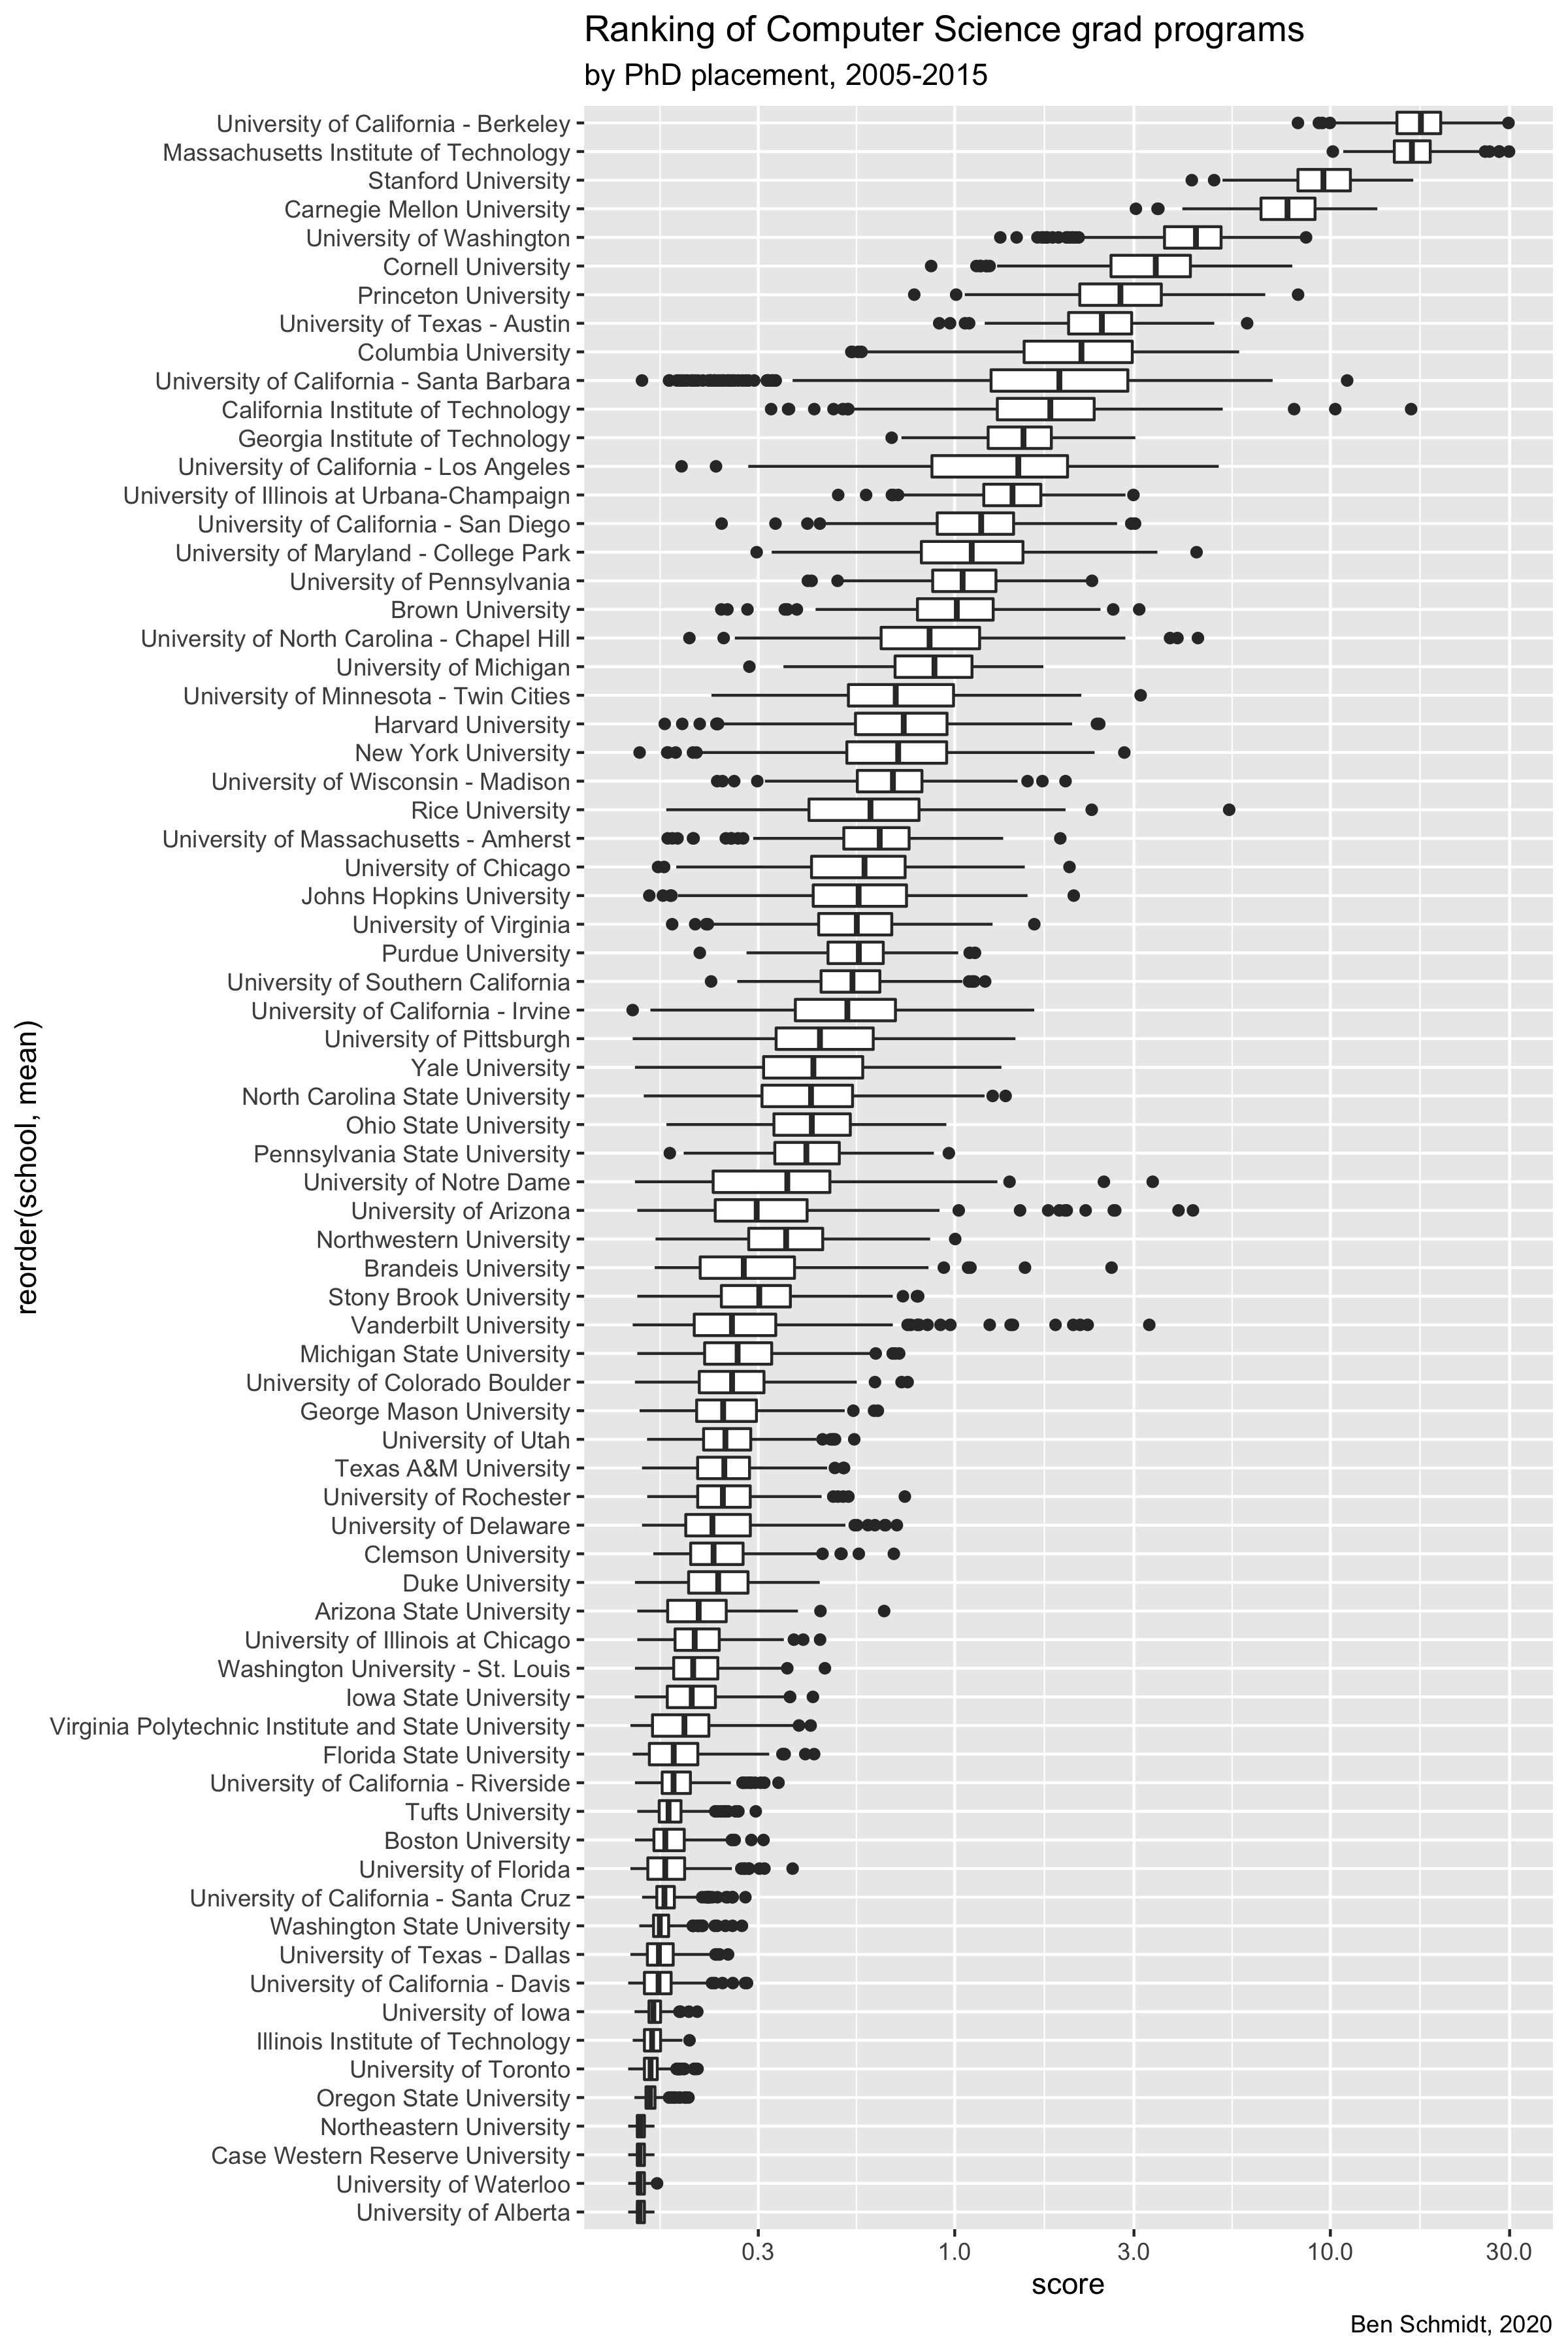
Here’s a plot of 500 random resamples of the set. There are two takeaways here:
- There’s decent separation overall, but in general the distinction between 1 and 2 on the list, or between 30 and 60, is not anything stunning.
- A few schools show notable patterns high or low. I think this is because single people greatly affect rankings. For example, UC Santa Barbara has a number of quite low rankings outside its boxplot; I think those are runs where both their grad who teaches at MIT and their grad who teaches at Berkeley were dropped in the bootstrap. Since UCSB relies very heavily on those two people for its high ranking, the bars are telling us–rightly–that the uncertainty there is pretty high.
Undergrad rankings
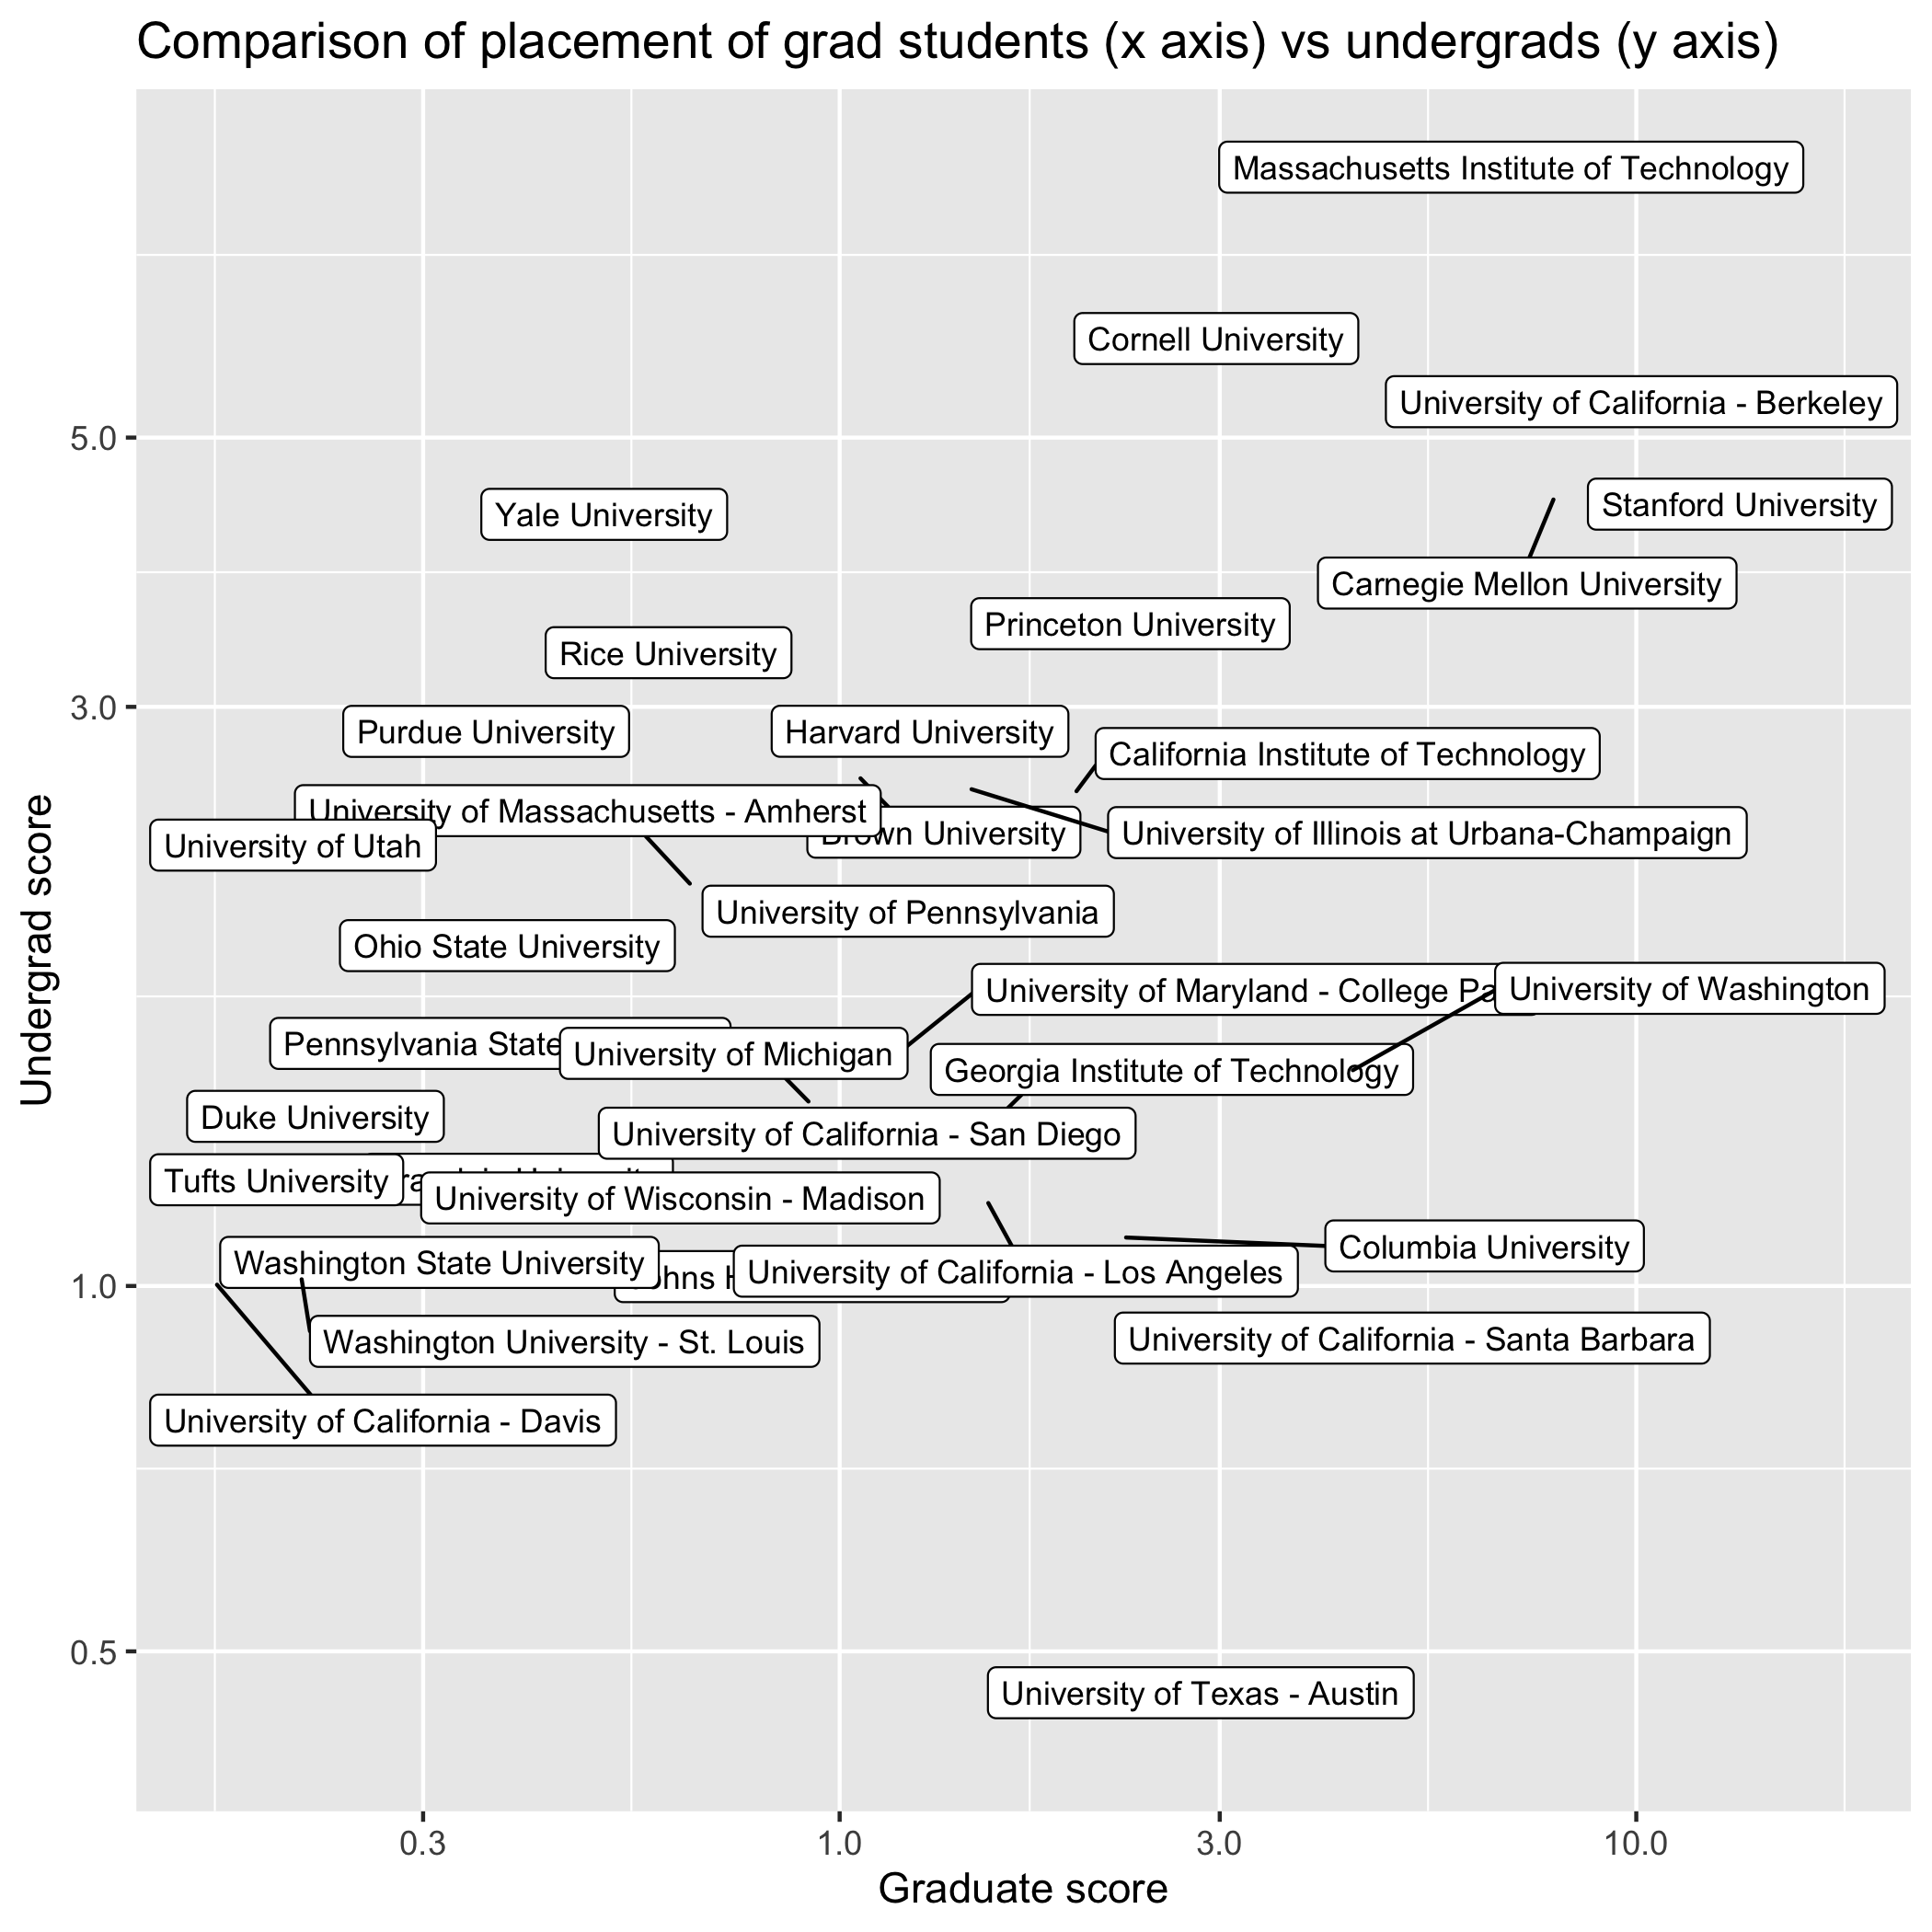
I’ve always wondered what the general form of this interaction would be; ignore disciplines, and just look overall at how universities assess other universities in their hiring patterns.
This dataset at least includes undergrad and master’s locations, so we can see how this form would work differently based on undergrad quality vs grad quality.
In general, the scores are correlated–for example, MIT and Berkeley are near the top on both– but there are some useful distinctions. For instance, Yale undergrads are very well represented in CS faculties, while Yale grad students are few and far between. Conversely, the University of Washington produces middling undergrads, but is a grad powerhouse. Presumably the major factor here is that undergrads do not choose schools based on the strength of individual departments.
Ben Schmidt
Director of Digital Humanities and Clinical Associate Professor of History
I am a digital historian and Director of Digital Humanities at NYU.